Sample Tutorial 4: The Synaptic Integration Tutorial
In this advanced tutorial the user explores how postsynaptic potentials spread from dendrites into a motoneuron's soma and subsequently initiate action potentials in the cell. The user specifies the properties of the synaptic inputs onto each of three passive dendrites and observes the resulting, complex voltage changes throughout the cell.
- In the actual tutorial on the CD, clicking the START THE SIMULATION button would bring up the control panels and plotting graphs.
- Note that neither the tutorial nor the hyperlinks are operative here.
Synaptic Integration
Explore Integration of Excitatory and Inhibitory Inputs on Multiple Dendrites
In this tutorial you will simulate a simplified spinal motoneuron of the cat.
NEURON is capable of handling the full set of descriptive details of a real neuron: its morphology (measured from dye-labeled cells), channel types, channel locations and densities, and synaptic locations throughout the full dendritic tree. In this tutorial we will restrict these parameters to a manageable subset.
A simplified neuron can be surprisingly complex.
Even with the reduced parameter set available in this tutorial, you may begin to feel overwhelmed by the complexity introduced by the limited set of possibilities here. There is much to be learned simply by changing the strengths, locations, reversal potentials, and onset times of the three synaptic inputs on the dendrites. We hope this tutorial will raise your sensitivity to oversimplifications in interpretation of published observations.
This "stylized" motoneuron has five different sections.
- The dendritic tree: The dendritic tree is now represented by three dendrites 1.5 mm in length and 24 μm in diameter, each with synaptic inputs whose location, strength, and timing may be controlled.
- The soma: The soma is represented by a cylinder 100 μm by 100 μm.
- The axon hillock: The axon hillock is the 10 μm region where the soma tapers from 100 μm to the 10 μm diameter of the specialized region called the "initial segment" of the axon.
- The initial segment: Between the axon hillock and the axon is the initial segment of the axon, 100 μm in length and 10 μm in diameter, where the axon is bare—not yet myelinated.
- The axon: The rest of the axon, 12 mm (12000 μm) in length, is myelinated (rather than bare as in the Site of Impulse Initiation tutorial). You will explore whether the presence of myelin is important in determining the site of impulse initiation.
The densities of the channels in the various segments have been chosen based on experimental evidence.
The channel densities in each structural component have been chosen to match available experimental observations in the spinal motoneuron of the cat. For didactic purposes, the dendrites in this tutorial are passive, although it is now known that the dendrites of CNS neurons can have voltage-gated channels in their membranes.
Goals of this Tutorial
-
To compare the site of impulse initiation in this neuron, whose axon is myelinated, with that in the unmyelinated axon in the Site of Impulse Initiation tutorial
-
To explore how impulse initiation depends on each of the following:
- The timing of the synaptic inputs on each of three dendrites
- The location of these synapses
- The temporal pattern in a train of impulses arriving at a single synapse
- The temporal pattern, strength, location and reversal potential of the synaptic inputs on each of the three dendrites
Start the Simulation
Click this button to bring up the panels and windows of the simulation.
Description of the Panels and Windows Customized for this Tutorial
-
AssumptionsThis tutorial assumes that you are incredibly facile with NIA manipulations, even making right-mouse-button discoveries on your own. It also assumes that you have completed the three Patch tutorials on synaptic transmission in the Basic section and the Site of Impulse Initiation tutorial.
-
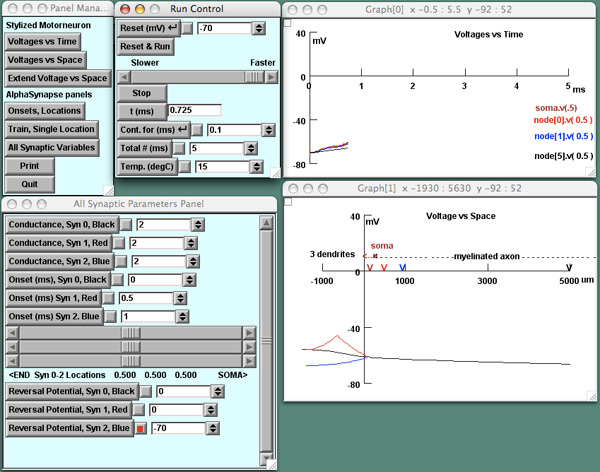
The AlphaSynapse panelsEach of the experiments in this tutorial has a special, dedicated AlphaSynapse panel that permits you to change certain variables of the synapse. Each of these panels will appear in the same position (lower-left portion of the monitor) when you launch it from its button in the P&G Manager. When you click Start the Simulation, the AlphaSynapse panel for the first experiment, entitled "Vary Onsets and Locations" (see also title in bar at the top of the panel), comes up automatically.The "Vary Onsets and Locations" AlphaSynapse panel allows you to change certain variables of the synapses on the three dendrites:
- The conductance, which in this menu is the same for all inputs
- The onset of each synaptic potential, which can be adjusted for each synapse separately
- The location of each synapse on the dendrite, adjustable by a slider for each synapse as shown in the diagram
The text line just below the three sliders shows, from left to right, the location of each synapse as a fraction of the distance from the end (1) of the dendrite to the soma (0).
-
The graphs
-
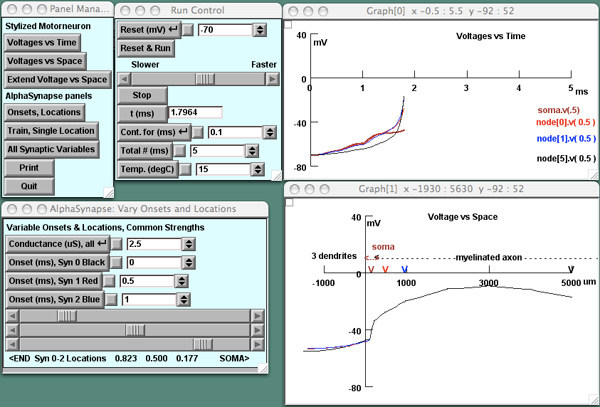
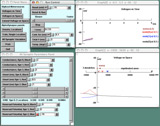
The Voltage-vs-Time plot (upper right): Four electrodes record the voltage change in the soma and axon in these color-coded positions:
- in the soma (thicker trace, brown)
- at node [0] (0.35 mm from soma, red)
- at node [1] (1.1 mm from soma, blue)
- at node [5] (5.1 mm from soma, black)
- The Voltage-vs-Space plot (lower right): The dimensions of the dendritic tree, soma, and 5-mm-long portion of the axon comprising this x-axis are shown on the diagram above. The positions of the four recording electrodes are indicated on the axis by the color-coded arrowheads.
- The Extend-Voltage-vs-Space plot (launched from P&G Manager): This graph extends the x-axis from 5000 μm to 12000 μm, which allows you to see where the impulse initiates in the axon.
-
The Voltage-vs-Time plot (upper right): Four electrodes record the voltage change in the soma and axon in these color-coded positions:
Experiments and Observations
Generate EPSPs in the dendrites and observe where the spike initiates.
-
 Press R&R to deliver three EPSPs 0.5 ms apart at three dendritic locations.
In this first simulation, note the staggered locations of the inputs (EPSPs) to the three dendrites by checking the positions on the sliders. They occur in sequence—at 0 ms for the input onto the black dendrite, 0.5 ms for the input onto the red dendrite, and 1 ms for the input onto the blue dendrite. -
Find where the spike is initiated.
The Voltage-vs-Space plot shows only the initial 5000 μm of axon. Launch the Extend-Voltage-vs-Space plot to see the full 12000 μm length of this myelinated axon. Now examine both plots to see if you can determine where the spike is initiated. -
Examine the voltage change in the initial segment and axon.
For a paused-action view of the sequence of events, advance the movie with the "Reset" and "Continue for (ms)" buttons in increments of 0.1 ms or another value of your choice. Notice especially the voltage change in the initial segment. Why is it so steep? -
Examine the voltage change in the soma and dendrites.
The impulse, initiated in the axon, backpropagates into the soma, its peak amplitude progressively decreasing from node[5] to node[0]. The soma struggles, unable to depolarize even up to 0 mV. Backpropagation of the depolarization continues into the dendritic tree, where most of each dendrite is depolarized to about –40 mV.- Question: Recent experiments reveal that action potentials can backpropagate into the dendritic tree in certain CNS neurons. What effect would this dendritic depolarization have on subsequent synaptic inputs on a dendrite? Click here for a discussion of this question.
-
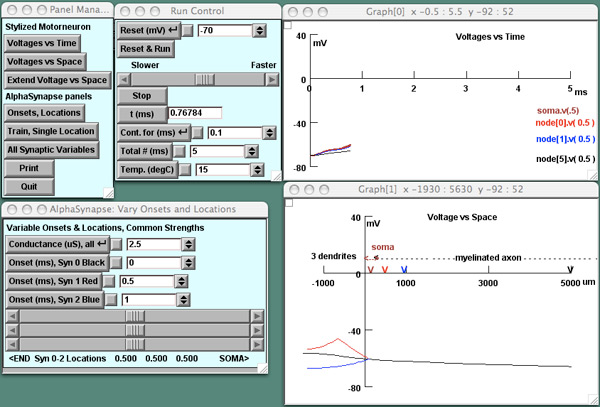
Reverse the timing or locations of the EPSPs so that the EPSP near the soma comes first.
Deliver the first EPSP near the soma and the last near a dendritic end. You can do this either (1) by simply reversing the values of the onset times for Syn 0 Black and Syn 2 Blue, leaving their locations the same, or (2) by reversing synapse locations as shown below. The EPSP occurring first will now be closest to the cell soma. Will this sequence of EPSPs cause an action potential to initiate? Click here for a discussion of this experiment. Try moving the location of the most distal synapse to see how its position affects your results.Original locations:
Reversed locations:
Deliver a train of synaptic inputs at a single synaptic location.
 The temporal pattern of impulses in a train arriving at a synapse is thought to be important in determining whether or not a neuron fires. In this tutorial you can arrange to have the three EPSPs arrive at one synapse on one dendrite, simulating the first three impulses of a train.
-
Bring up a new AlphaSynapse menu.
Click the "Train, Single Location" button in the Panel Manager. There is no need to close the previous menu; the new one will replace it.Trains in NEURONThe simulator views a train as three synapses at the same location (indicated by the slider position), in this case on the red dendrite. The onset of each EPSP is set independently.
-
Deliver the train.
Run the simulation with the default parameters and watch the movie of the three EPSPs. The conductance increases have been made the same for each EPSP to keep this experiment from becoming too complex. Look carefully at the amplitudes of the EPSPs: With identical conductance increases, do they add linearly? If you have completed the Interactions of Synaptic Potentials tutorial, you should be able to explain how the EPSPs add. -
For bringing the neuron to threshold, are EPSPs in a train equivalent to those same EPSPs occurring simultaneously?
When neurotransmitter (released from the presynaptic terminal) causes a conductance change in a dendrite, which gives rise to a synaptic current, that current flows forward in the cell to depolarize the region of spike initiation. The amount of current is the important factor in whether the neuron will depolarize enough to initiate an action potential. Will three EPSPs in a train cause less, more, or the same amount of current to enter the cell as three EPSPs occurring simultaneously?-
Determine the threshold conductance for the three EPSPs in the train at the 0.5 location.A fast way to search for the threshold conductance is to use the arrows in the spinner box to make your changes, because a simulation will automatically run when you make the change. (Reminder: Clicking the right mouse button on the UP arrow in the spinner box will allow you to select the decade in which the arrows of the box make changes.)Keep in mind, in thinking about the relevance of these experiments to CNS integration, that conductance is equivalent to amount of neurotransmitter gating the postsynaptic receptors on the dendrites.
-
Now set all three onset times to 0 ms and determine the threshold conductance again.Explain your results. As an advanced exercise to test your explanation, you can experiment with the timing of the EPSPs in the train. What is the lowest synaptic conductance at which you can produce an impulse by playing with the interspike intervals?
-
-
How does threshold change for the EPSPs in the train, and for those occurring simultaneously, as a function of synapse position on the dendrite?
Find the threshold synaptic conductance as a function of the position of the synapse along the dendrite for the EPSPs occurring in the train. What do these relations tell you about voltage spread in a passive dendritic arbor?
How does inhibitory synaptic input (an IPSP) at one synapse affect voltage spread and impulse initiation?
-
 Press the "All Synaptic Variables" button.
The AlphaSynapse menu that is called up allows you to vary four parameters for each synapse:- Conductance
- Onset
- Location
- Reversal potential
-
Make one synaptic input an IPSP.
Set the reversal potential of one of the synapses to a value more negative than the resting potential of –70 mV. Run the simulation. You have the tools to do a large number of experiments with this neuron. For example, you can test parameters that might change the effectiveness of the IPSP in blocking impulses generated by one or two EPSPs. (You can set a conductance to zero to remove an input.) For the IPSP, explore the effect of changing the following:- Its onset time with respect to EPSPs
- Its location
- Its conductance change
- The value of its reversal potential
-
Not satisfied? Change the temperature.
If you find these experiments insufficiently challenging, you can investigate how temperature affects spike generation for the whole parameter set!