Sample Tutorial 1: The Membrane Tutorial
This tutorial begins with a plain lipid bilayer and successively adds a resting potential, leak channels, and finally the voltage-gated sodium and potassium channels that underlie the action potential. The user delivers a current pulse across the membrane and observes the resulting voltage change under the conditions he or she specifies in the parameters menu.
This tutorial should help the user understand Ohm's law and the difficult notion of capacitance as applied to the membrane.
- In the actual tutorial on the CD, clicking the START THE SIMULATION button would bring up the control panels and plotting graphs.
- Thumbnails along the left side of the text below can be clicked to show screenshots from the tutorial in progress.
- Note that neither the tutorial nor the hyperlinks are operative here.
The Membrane Tutorial
How Currents Depolarize Excitable Membranes
 Here you will build an excitable membrane.
How do the component parts of membranes (the capacitance of the lipids, the pumps, and the conductances of the channels) work together to permit voltage signaling? The simulations below approach this question by starting with a bare lipid bilayer membrane and adding new mechanisms in a stepwise fashion.
You will inject current across the membrane and measure the resulting change in the voltage.
You will deliver a pulse of current across the membrane and observe how it changes the voltage across the capacitance of the membrane. Further, you will observe the capacitive current flowing onto the membrane during the pulse. These experiments are carried out in a "patch."
Goals of this Tutorial
-
To understand, through experimentation, how a current pulse changes the voltage across a membrane:
- when it is only a plain lipid bilayer
- when it has only a Na/K pump that establishes a resting potential
- when it has, in addition to the pump, a voltage-insensitive, non-selective "leakage" conductance
- when it has, in addition to the pump and leakage channels, the voltage-sensitive Na and K channels described by Hodgkin and Huxley
-
To understand capacitance and capacitive currents and why they are important for understanding neuronal signaling

Description of the Panels and Windows Customized for this Tutorial
-
AssumptionsWe assume you have worked through the Introduction to Neurons in Action tutorial and are familiar with the general structure of the simulation panels. Here we describe the panels and graphs, customized for the Membrane Tutorial.
-
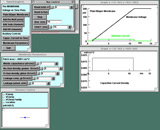
 Starting the simulation, 3 panels appear:
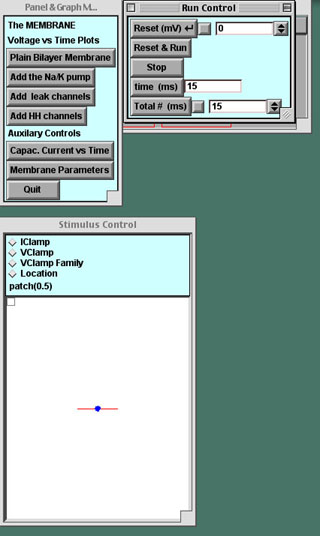
- The P&G Manager, in the upper left corner
- The upper four buttons bring up graphs one by one linked to the experiments below; they will lie on top of one another as they are called up.
- The "Capacitive Current vs Time" and "Membrane Parameters" buttons call up windows that will be useful later in the tutorial.
- The Run Control panel, next to the P&G Manager. The buttons on this panel are common to all of the tutorials.
- The Stimulus Control panel, below the other two panels.
- When launched, this panel automatically inserts a stimulating electrode into the patch. By default the "Location" option is selected, showing the electrode (blue ball) located in the center of the patch (the line).
- In the experiments below you will click the IClamp diamond to see the default delay, duration, and amplitude of the stimulus current pulse.
- The P&G Manager, in the upper left corner
Experiments and Observations
Before experimenting:
Please read here about capacitance, electrical "equivalent circuits," and why the concept of capacitance is useful and important to the neuroscientist.
| Please note! | In The Membrane Tutorial it is important to bring up the panels in the prescribed sequence in order to avoid confusing NEURON. |
Experiment with charging a lipid bilayer with a current pulse.
-
First, observe how a current pulse charges a membrane.
-
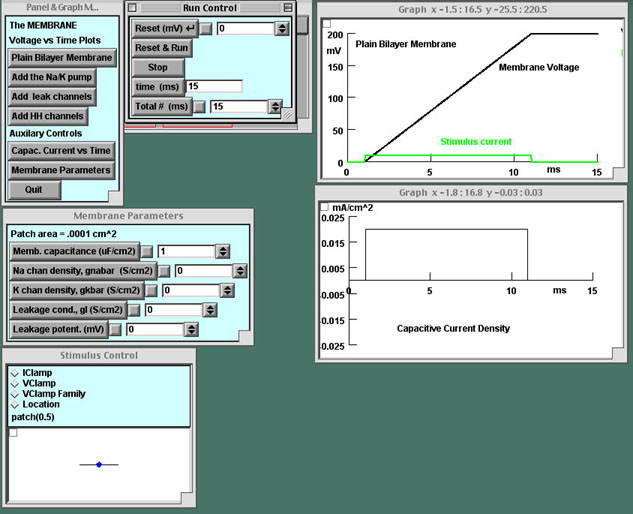
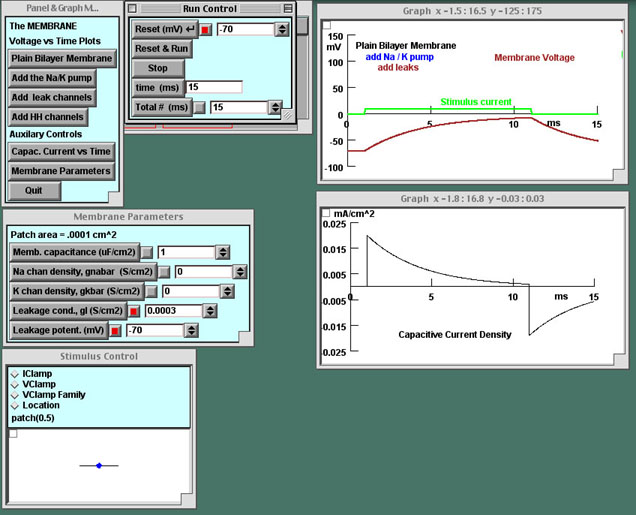
 Press the "Plain Bilayer Membrane" button (in the P&G Manager) to call up a Voltage-vs-Time graph.
In this simplest possible experiment you will deliver a current pulse to the membrane and observe the rate of change of the voltage across the membrane capacitance (as represented by the circuit illustration below). Note that depolarizations will be plotted from zero: As yet there is no resting potential in this cell.
Press the "Plain Bilayer Membrane" button (in the P&G Manager) to call up a Voltage-vs-Time graph.
In this simplest possible experiment you will deliver a current pulse to the membrane and observe the rate of change of the voltage across the membrane capacitance (as represented by the circuit illustration below). Note that depolarizations will be plotted from zero: As yet there is no resting potential in this cell.
-
 Run the simulation: Charge the membrane.
When you press the "Reset & Run" button in the Run Control panel, the stimulating electrode will deliver the current pulse to the membrane and the voltage across the membrane will be plotted. The plotted current pulse has no associated scale but is proportional to the stimulus current. Observe that the membrane potential changes as a linear ramp until the current ceases; from that time forth the voltage stays at that level. The membrane is charged to a certain voltage; it will stay at this voltage since there is no path for the current to leave the capacitor.
Run the simulation: Charge the membrane.
When you press the "Reset & Run" button in the Run Control panel, the stimulating electrode will deliver the current pulse to the membrane and the voltage across the membrane will be plotted. The plotted current pulse has no associated scale but is proportional to the stimulus current. Observe that the membrane potential changes as a linear ramp until the current ceases; from that time forth the voltage stays at that level. The membrane is charged to a certain voltage; it will stay at this voltage since there is no path for the current to leave the capacitor.
-
 Press the "Capacitive Current-vs-Time" button to call up a second graph.
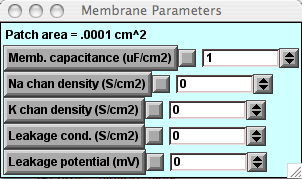
This graph will appear beneath the Voltage-vs-Time graph and will show the capacitive current density (capacitive current per unit area) being plotted when you run a simulation.Note that the amplitude of the stimulus current pulse is 2 nA, and the area of the patch is 0.0001 cm2 (displayed on the Membrane Parameters panel). Thus the capacitive current density across the plain lipid bilayer will be 0.02 mA/cm2.
Press the "Capacitive Current-vs-Time" button to call up a second graph.
This graph will appear beneath the Voltage-vs-Time graph and will show the capacitive current density (capacitive current per unit area) being plotted when you run a simulation.Note that the amplitude of the stimulus current pulse is 2 nA, and the area of the patch is 0.0001 cm2 (displayed on the Membrane Parameters panel). Thus the capacitive current density across the plain lipid bilayer will be 0.02 mA/cm2. -
Calculate the expected rate of change of membrane voltage from the equation for capacitive current.You can measure the rate of change of the voltage to see if it agrees with your calculation. Consult this link if you need assistance.
-
Store your traces for comparison with the next experimental result.
 To save a plot for comparison with a new plot when you make changes below, use the "Keep Lines" feature. Place your cursor in the plotting window, click the right mouse button, hold it down, and then select this option. The cursor MUST be placed within the plotting window for this option to work. (Macs: click on the tiny box in the upper left corner of the graph.) If you right-click again and view the submenu, you will see a red check next to "Keep Lines," confirming your selection.
-
-
 Change the amplitude of the current pulse.
-
Press the "IClamp" diamond in the Stimulus Control panel.The parameters of the current pulse will be revealed in the lower half of the panel. Change the current stimulus amplitude with the arrows to the right of the white value field or with the field editor. You MUST have the cursor positioned in the white field when you enter changes using the keyboard.
-
Click "Reset & Run" with the amplitude at its new value.If the plot axes are too large or need expansion, you can resize them by right-clicking on the graph and selecting View = plot. If you wish to restore the original size, however, you will have to first close and then re-open the graphing window.Is the slope of the voltage change directly proportional to the current amplitude? Should it be? Click this link if you are unsure.
-
Erase your plots and restore the default current setting to prepare for the next experiment.You can clear the plot at any time with the "Erase" feature in the menu called up by the right mouse button. You restore the default setting by clicking on the box with the red mark on it.
-
-
 Change the membrane capacitance.
-
Call up the Membrane Parameters panel.If you have not already done so, press that button in the P&G Manager. Change the capacitance, click "Keep Lines," and re-run the simulation. How is the slope of the voltage change related to the capacitance?
-
Restore the membrane capacitance to its default value.Always restore default values when you are finished with an experiment.
-
Do you understand capacitive currents?Understanding capacitive current is the first step in understanding the famous Hodgkin-Huxley (HH) equation used throughout the NIA tutorials. The first term in this equation is the capacitive current: the product of the membrane capacitance and the rate of change of the voltage. For the plain lipid bilayer, the HH equation is reduced simply to this first term because neither a leak conductance nor voltage-sensitive channels are included in this basic membrane.
-
Establish a resting potential by adding the Na/K pump.
 The resting potential comes about through the action of the Na/K pump (or Na/K ATPase) which simultaneously moves Na ions out of the cell and K ions in. How the precise value of the resting potential is achieved is approached in the Equilibrium Potentials tutorial.
-
Press the "Add the Na/K pump" button to establish a resting potential.
The Voltage-vs-Time graph will be overlaid by a new one showing that a simulated pump has been added, charging the membrane to a resting potential of -75 mV.Note that the "Reset (mV)" button in the Run Control panel now is marked by a red box because its value has been changed from 0 to -75 mV. -
Run the simulation.
Does the value of the resting potential affect the slope of the voltage ramp in response to a current pulse?
 Add "leak" channels.
 Hodgkin and Huxley observed a voltage-insensitive (linear) current in the squid axon with a reversal potential near the resting value. They referred to this current as "leak" and incorporated it into their equation to make the net current equal to zero at rest. Here we will place these very simple "leak" channels into our plain membrane to see how adding a simple resistor affects the charging and discharging of the lipid bilayer capacitor. Note in the diagram that, in contrast to the plain lipid bilayer, there is now a path (rleak) for current stored on the capacitor to leak back out across the membrane.
-
Press the "Add Leak Channels" button.
A new Voltage-vs-Time graph will replace the previous one.-
The value of the "leak" conductance assigned by Hodgkin & Huxley (0.0003 S/cm2) now shows up in the "Leakage cond." field of the Membrane Parameters panel. We replace the mho, the original unit for conductance used in the Hodgkin-Huxley papers, with the present-day notation, the siemens (S).
-
The "Leakage potential" has been set to –70 mV (from its previous value of –75 mV) to reflect the reduction in resting potential upon addition of a leak.
-
-
Run the simulation.
Now the time course of the change in voltage across the membrane is quite different from what you saw for a plain lipid bilayer.In the Hodgkin-Huxley (HH) equation there are now two terms that describe the situation at this point in the tutorial: the first term, for capacitive current, and the last term, the leak current. The other two terms are still zero because there are as yet no voltage-sensitive channels in the membrane. -
Be quantitative.
Measure the amplitude and time constant of the voltage change. These measurements are widely used in neurophysiological experiments.
Add Hodgkin-Huxley (HH) voltage-sensitive channels.
 Add the HH Na and K channels to the membrane to enable it to generate action potentials upon depolarization.
-
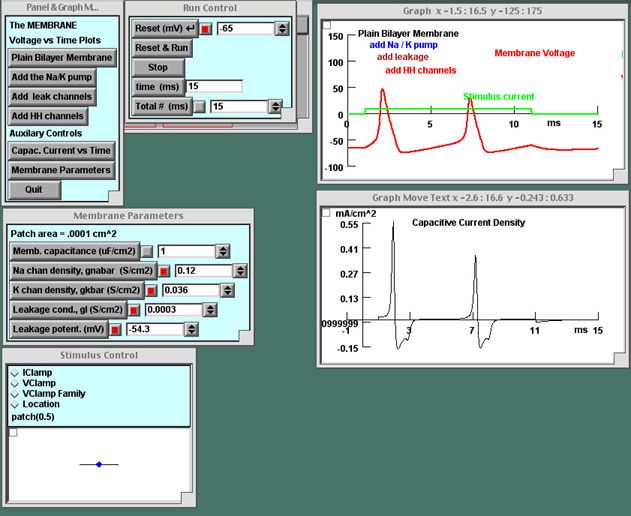
Press the "Add HH Channels" button in the P&G Manager.
Again an appropriate Voltage-vs-Time graph will open on top of the previous one. The default values for the densities (proportional to conductances) of the Na and K channels (as well as the HH values for the leak conductance and reversal potential) will appear in the Parameters panel. The resting potential (viewed in the "Reset" field in the Run Control panel) is further reduced by the small leak of Na into the cell. This matter will be further explored in the Equilibrium Potentials tutorial -
Run the simulation.
You should observe that two action potentials are generated during the current pulse. The capacitive current surges at the onset and offset of the pulse as it did in the previous exercise, but during the action potentials it has a more complicated shape. (Remember that you can "turn down the gain" for the capacitive current plot using the "View = plot" option on the pop-up menu. To restore the original gain, close and re-open the window.)
-
Consider these questions:
- Why is the capacitive current so large?
- Do you know at what point in the action potential the capacitive current is at its peak?
- At what point in the action potential does the capacitive current cross zero?
- During the falling phase of the action potential, why is the capacitive current more prolonged but smaller than during the rising phase?
- Click here for answers.
-
Experiment with increasing the duration of the current pulse
In the Stimulus Control panel, increase the stimulus current duration and then increase the "Total # ms" in the Run Control panel as you did above. Will spikes continue to be generated at this rate indefinitely?
Summary
 The two composite figures here summarize the three steps of this tutorial carried out with a resting potential. The upper figure shows the voltage responses to the current pulses at low gain; the lower figure shows the first few milliseconds at high gain and expanded time base to enable you to resolve the differences between the traces in this time period.
- Black trace: When the current pulse charges the bare membrane, the voltage rises as a linear ramp.
- Brown trace (leakage): The addition of leakage channels causes the voltage to deviate from the ramp after an initial rise along the ramp's trajectory. The rate of change of the voltage decreases as the voltage rises towards a steady-state level. At the end of the current pulse the voltage decays exponentially back to the resting potential.
-
 Red trace (HH channels): The addition of voltage-gated Na and K (HH) channels does not cause a noticeable change (from the voltage rise when only leak channels are present) until the action potential arises. The voltage then explosively increases at a rate far surpassing the linear ramp for the purely capacitive membrane.
In the expanded version of the figure you can see that the red curve initially overlays the brown curve (leakage conductance). This happens because the resting state conductances of the HH channels are insignificant compared to that of the leakage.
Press "Quit" to go to the next tutorial.
-
Press the "Quit" button (in the P&G Manager).
This button terminates the tutorial. It is distinct from "Close," which simply closes a panel. -
Confirm by clicking on the "Yes" button in the dialog box.
Attention! You must quit each simulation before going to the next to avoid having multiple copies of NEURON running, each with a different simulation and set of panels, electrodes, and settings.