Sample Tutorial 2: Chattering Ion Channels
In this tutorial the user can experiment with single Na and K channels, simulating patch clamp experiments. Repeated trials generate single channel currents stochastically, as with actual channels. Control of the voltage and observation of long periods of resulting channel activity makes it clear how depolarization favors the open state. By specifying the number of channels in the patch, from 0 to thousands, one can see how macroscopic currents arise from the summation of the single channel currents.
- In the actual tutorial on the CD, clicking the START THE SIMULATION button would bring up the control panels and plotting graphs.
- Thumbnails along the left side of the text below can be clicked to show screenshots from the tutorial in progress.
- Note that neither the tutorial nor the hyperlinks are operative here.
Chattering Ion Channels
Patching Single Na and K Channels
One could argue that the basis of life lies in ion channels.
 With the help of ionic pumps that establish the transmembrane voltage, ion channels control so many of the processes fundamental to a living organism. Perhaps using transporter proteins a different sort of Life could be established, but it would be so slow!
This tutorial will enable you to experiment with single channels.
You can study the behavior of single Hodgkin-Huxley (HH) Na and K channels, which are the voltage-gated ion channels that underlie the action potential in squid axons and most other axon types. These channels are only two of the many different subtypes of Na and K channels currently described, but certainly two of the very crucial ones. The understanding of single channel behavior gained in this tutorial should permit you to readily identify variations employed by other channels, giving rise to a diversity of functions.
Here you will simulate patch clamp experiments.
Until Neher and Sakmann invented the patch clamp technique in 1976, we could only imagine how these postulated channels might open and close. Did they open like a circular valve, a small hole expanding gradually into a larger one? Did they open in a series of transitions? Was there a molecular stopper that plugged and unplugged the channel? Using the patch clamp it was fantastic to see the square-shaped currents that showed the channels flipping in an instant between an open and closed state. Perhaps this tutorial can convey some of the excitement of seeing channels in action and finding out how they behave.
Goals of this Tutorial
-
To observe, measure, and understand the features of the currents flowing through single, voltage-gated Na and K channels
-
To appreciate the stochastic nature of the gating of single channels by voltage
-
To understand, through experimentation, how depolarization favors the open state of the channel
-
To conceptualize how macroscopic currents, in populations of many channels, arise from the aggregate behavior of the microscopic currents through individual Na and K channels

Description of the Panels and Windows Customized for this Tutorial
-
AssumptionsThis tutorial assumes that you are now familiar with the basic manipulations of the panels and graphs and that you know how to Keep Lines, Erase, use the Crosshairs, and use View = plot within the graphs.
-
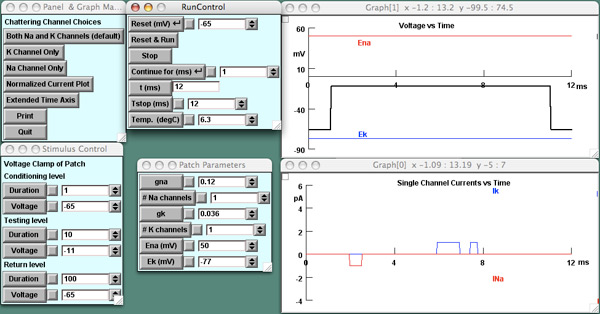
The graphs appearing upon launching the simulator
- The uppermost graph, Voltage vs Time, simply displays the voltage clamp step.
- The second graph displays the Single Channel Currents vs Time. When you increase the number of a given type of channel beyond 3 or 4 in the experiments below, you will have to use View = plot in the submenu to see the summed currents.
-
Panel and Graph Manager
- Top three buttons: You can record from a patch containing either Na channels, K channels, or both channel types (default). Each button calls up a Current-vs-Time graph displaying single channel currents from a patch containing that particular channel type.
- Normalized current plot: This button calls up a graph in which the current is normalized so that the summed currents may be viewed when you have many channels in the patch. Plots of the macroscopic Na and K currents are continually displayed in this graph so that the summed single channel currents may be compared to them.
- Extend time axis: With this button you can call up a Current-vs-Time graph in which a long pulse (110 ms default) is delivered to the patch, permitting you to observe many single channel openings.
-
Stimulus ControlUsing a single electrode clamp, this voltage clamp panel controls the duration and value of the three levels of the voltage clamp: the Conditioning Level, the Testing Level, and the Return Level.
-
Patch ParametersIn this panel you control the number of Na and K channels in the patch as well as the Na and K conductances and equilibrium potentials. When you specify one channel type by its button in the Panel and Graph Manager, the conductance of the other channel type will automatically be set to zero.
Please Note! In order to "remove" a channel from the patch, set its conductance, not its number, to zero. Setting its number to zero will give you meaningless results.
Experiments and Observations
Observe single Na and K channels in a patch.
By default, you start with a patch containing a single Na channel and a single K channel.
-
Record both Na and K currents in response to a depolarizing voltage step.
-
You have isolated a patch.With considerable skill, you have successfully isolated an outside-out patch of membrane where you hope to observe single Na and K channels. Your external bathing solution has typical extracellular Na and K concentrations and the solution inside the pipette has typical intracellular concentrations, establishing the values of ENa and EK shown in the Patch Parameters panel. Your recording circuit is arranged so that currents that would flow inward are negative-going.
-
Voltage clamp your patch.Holding your breath, you press R&R to clamp the patch from -65mV to -11mV (a value half-way between ENa and EK). Do you observe single channel currents (middle graph)? If you don't, press it again...and again: channel openings are probabilistic. Are there two types of current in the patch that might correlate with what you have learned about Na and K currents in the Sodium Action Potential tutorial?
-
-
Study the opening and closing of these channels.
-
Observe the form of the channel openings.Does each channel open and close slowly so that the conductance gradually increases and then decreases? Does it open in steps? Or does it snap open and then maintain a certain value of conductance until it closes? Until the patch clamp, we really didn't know. Imagine the thrill Neher and Sakmann must have felt upon seeeing these "square" openings for the first time in 1976. (The blips on the rising and falling phases of the voltage step and channel currents are due to the computer plotting algorithm.)
-
When does each channel type open?If you press R&R repeatedly, you should observe that the time until opening for each channel is unpredictable. So, then, does the depolarizing step "open the channel"?
-
What if you do not apply a depolarizing voltage clamp step?You can test what happens without a depolarizing voltage clamp step by setting the Testing Level to -65mV, the same value as the resting potential and as the Conditioning Level. Now press R&R repeatedly to see if any channels are opening without depolarization. Do you observe channel openings? Should you?
-
Study a single K channel by itself.
-
Press "K channel only" in P&G Manager.
This is equivalent to putting tetrodotoxin in your external saline to block the Na channels in the patch. In the Patch Parameters menu, note that gNa is now set to zero.-
Voltage clamp your patch.Notice that in the Patch Parameters Panel there is one channel in the "# K channels" field. Depolarize the patch from –65 mV to –11 mV in Stimulus Control, then press R&R. Keep pressing R&R until you see channel openings. What is the evidence that you are observing a K channel (other than the writing on the button)?
-
Are there two current amplitudes?If your channel opens toward the end of the pulse, you might observe two amplitudes of current and your first thought might be that there are two conductance states for this K channel. But look closely: Does the smaller current actually occur after the voltage step is turned off? Might it be that both currents are occurring during the same prolonged channel opening, an opening that is outlasting the voltage step? If you don't understand what is happening, the experiments below should help.
-
First, focus only on the channel openings that close before the depolarizing step ends.Change the value of the step depolarization. We suggest stepping to –40 mV, –20 mV, 0 mV, and +20 mV. (Expand the current axis with View = plot on the graph submenu to make your events larger if you wish.) Be sure you understand three key observations of these single channel currents as you increase the amplitude of the depolarizing step.
-
-
What determines the amplitude of the current flowing through the K channel when it opens?
-
Prepare to measure the current as a function of voltage.When you do this you will discover, experimentally, that channel currents obey Ohm's law.
- Measure the current flowing through the open channel at each voltage. (Click on the current trace and observe the y-axis value in the top bar of the graph).
- Record the value of the current and the voltage step (on paper). Remember that you are only examining the current through a single K channel--your Na channel is blocked with tetrodotoxin. Does the K current through the channel become larger or smaller as the step voltage moves farther away from the value of EK (EK = -77mV: see Patch Parameters panel)?
- Plot your values of current versus the voltage step values. Current should be on the y-axis and voltage should be on the x-axis. Are your values in a straight line? If they are, why is the line straight? Extrapolate the line to see where it crosses the voltage axis (current = 0). What is the significance of the voltage value is this crossing point?
- So did the current get bigger as the voltage moved away from EK or moved closer to EK? As you clamp to a voltage closer to EK, the "driving force" on the K ion (Vm minus EK) will decrease. You can play with this concept by changing the value of EK as well in the Parameters Menu.
-
Questions:
- Do you understand why you observe a smaller amplitude of current at the offset of the pulse if the channel opening outlasts the pulse?
- What should you observe if you step the voltage to a value negative to EK?
- Will the single channel conductance change with voltage?
- Is conductance a value you determine by measurement or by calculation?
-
-
 Observe the effect of membrane potential on the time that the channel spends in the open state.
Compare the durations of channel openings at –25 and at +40mV during a very long test pulse.-
Press the "Extend Time Axis" button to bring up a graph that extends the x-axis (to 120 ms by default).Pressing this button will also automatically change the duration of the test voltage clamp pulse to 110 ms. Note that the Total # (ms) (in Run Control) is now 120 ms.
-
Run the simulation with your test pulse at –25mV.The channel will open and close repeatedly. The durations of the channel's open states probably appear random. Indeed they are; if you were to patiently measure the durations of a large number of events, put them in duration bins, and plot the number of events in each bin versus event duration, you would find that the shortest durations occurred with the highest frequency and that the distribution fell off exponentially, as is characteristic of a plot of stochastic events.
-
Save a trace using Keep Lines. Run the simulation again with the test pulse at +40mV.Because the driving force at the two test potentials is different, the amplitudes of the currents will be different and you should be able to easily distinguish the durations of the openings at each potential. Observe any difference in the open times of the channel at the two potentials and explain your observations.
- If you were now to measure the durations of a number of these events and again plot the number of events in each duration bin versus event duration, you would find a new exponential distribution at this new membrane potential. This type of measurement of open (and also closed) durations has enabled the modeling of the number of states (conformational changes in the protein) through which a channel passes as it opens and closes, the forward and backward rate constants between states, and their dependence on membrane potential.
-
Close the Extended Time Axis graph and reset all default settings.
-

Study a single Na channel by itself.
-
Press "Na channel only" in the P&G Manager.
This is equivalent to putting TEA (tetraethylammonium ion) in your external saline to block the K channels in the patch. In the Patch Parameters menu, note that gK is now set to zero.-
Study one channel (specified by "1" in the "# Na channels" field of the Patch Parameters panel).Depolarize the patch from -65mV to -11mV in Stimulus Control, then press R&R. Keep pressing R&R until you see channel openings.
- When during the pulse does the Na channel tend to open?
- How does this time at which the Na channel tends to open compare to that of the K channel?
- How does the average open time of the Na channel compare to that of the K channel? Explain any difference.
- Are there Na channel openings late in the pulse? If there are very few, why is this?
- When a channel closes, can you tell whether it has truly closed or whether it has become inactivated?
- Summarize the evidence that you are observing a Na channel (rather than a K channel) and think of other experiments you could do to glean more evidence.
-
As you did above for the K channel, explore how the current through the Na channel depends on voltage.
- Change the value of the step depolarization to –40 mV, –20 mV, 0 mV, +20 mV, +40 mV, and +60 mV.
- Plot your values of current versus the voltage step values. Are they in a straight line? Does it cross the voltage axis? What voltage value is this crossing point?
-
Increase the number of channels in the patch.
-
 Press "Both Na and K channels" in the P&G Manager.
-
Observe two channels of each type.Enter "2" in the "# Na channels" and "# K channels" fields of the Patch Parameters panel.
-
Depolarize the patch from –65mV to –11mV in Stimulus Control.Press R&R repeatedly. Sometimes you will see only one Na or K channel opening. Sometimes, however, you will see the two single channel currents adding together indicating that the two channels have both opened at nearly the same time. If you observe two channel openings but they are separated in time and do not sum, can you tell whether one channel opened twice or both channels opened?
-
Observe how recruiting single channels builds up the macroscopic currents.Call up the "Normalized current plot" graph (if you have not already done so) to observe how adding more and more "chattering channels" to the patch gives rise to the macroscopic Na and K currents plotted in the graph. Add a third channel of each type and give successive pulses to observe the openings.
-
Increase the number of each channel type to 10.Make sure you understand:
- Why the ensemble of channel openings looks so different from trial to trial
- Why there tend to be more openings of K channels later in the pulse
- Why all of the Na channel openings seem clustered at the beginning of the pulse, with openings at the end very rare
-
-
Increase the number of channels in the patch to the hundreds, then thousands.
-
Go for it: Increase the number of channels to 100 each and then 1000 and then 10,000.You should see how the macroscopic currents, observed in the Patch Voltage Clamp Tutorial, emerge as the "ensemble average" of the opening of these many channels. While any one channel behaves stochastically, the opening of the population of channels yields an ever smoother current plot as the number of channels is increased.
-
